
Bài mẫu tham khảo cách viết dạng bài Pie Chart trong IELTS WRITING TASK 1.
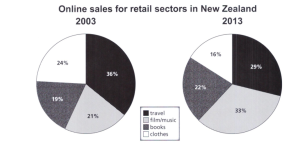
The pie charts below show the online shopping sales for retail sectors in New Zealand in 2003 and 2013.
Summarise the information by selecting and reporting the main features, and make comparisons where relevant.
SAMPLE ANSWER
The pie charts give information about the percentages of online sales across different retail sectors in New Zealand in the years 2003 and 2013.
It is clear that there was significant change in the proportions of online transactions for three of the sectors over the period shown.
At 36%, the travel sector accounted for the majority of online sales in 2003, but this percentage had dropped to 29% by 2013. Across the same ten-year period, as an increasing number of people chose to purchase films and music online, we can see that transactions went from just 21% to 33%, making it the retail sector with the highest overall share of the online market.
In 2003, the clothing industry boasted an impressive 24% of total online sales in New Zealand. However, by 2013, the figure had fallen considerably to 16%. Interestingly, online sales of books eventually overtook sales of clothes, although books still represented only 22% of the market.
Tags: ielts, IELTS WRITING