
Bài mẫu tham khảo cách viết dạng bài Bar Chart trong IELTS WRITING TASK 1.
The chart below gives information on the percentage of British people giving money to charity by age range for the years 1990 and 2010.
Summarise the information by selecting and reporting the main features, and make comparisons where relevant.
SAMPLE ANSWER
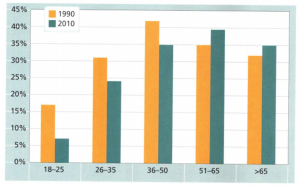
The bar chart shows the proportion of people of different ages in Britain who gave money to charity in 1990 and 2010.
It is clear that a greater percentage of British people in the youngest age groups gave money to charity in 1990 than in 2010, whereas the reverse is true for the oldest age groups.
In 1990, 42% of the 36-50 age-group made charitable donations, and this figure is the highest on the chart. In contrast, the 18-25s contributed the least at only 17%. By 2010, these figures had fallen significantly to 35% and 7% respectively. The level of donations from the 26-35 age-group also experienced a decrease in 2010 from 31% to 24%.
The percentage of donors among the 51-65 age-group rose from about 35% to nearly 40%, which was the highest proportion for 2010. The figure for the over 65s was lower than this, at 35%, but it was still slightly higher than the 1990 figure of 32%.
Tags: ielts, IELTS WRITING